Azure DevOps Integration

Turn Azure Data into Actionable Insights

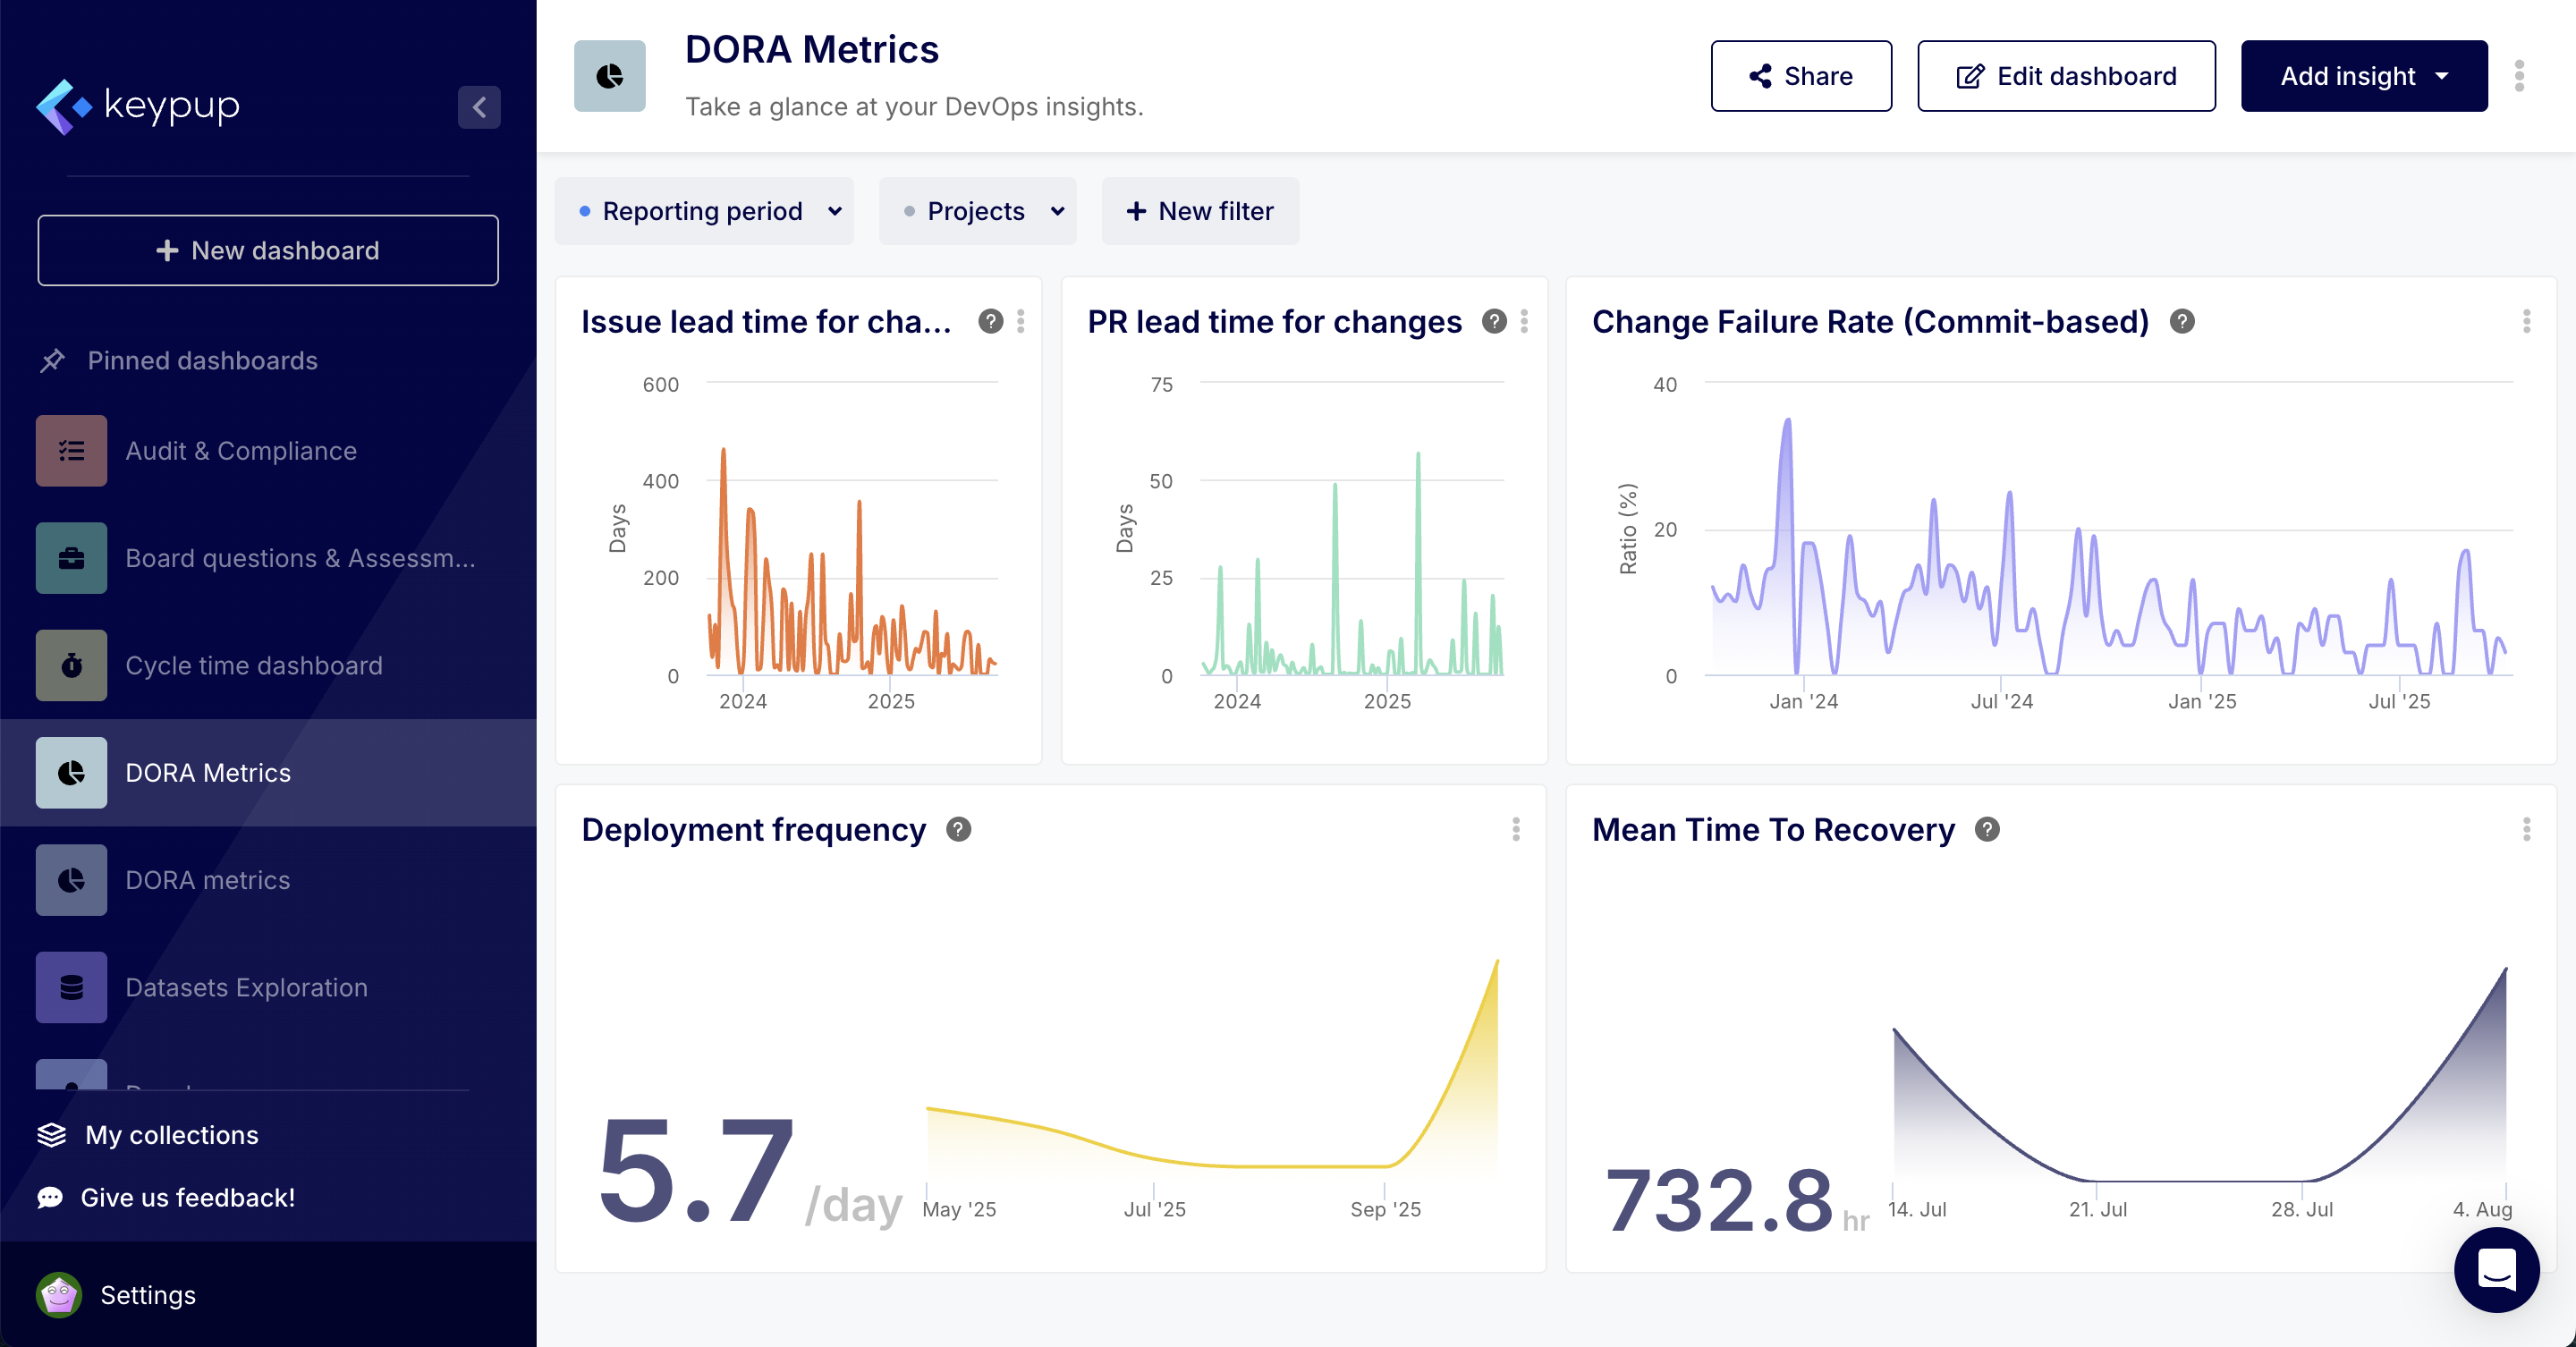
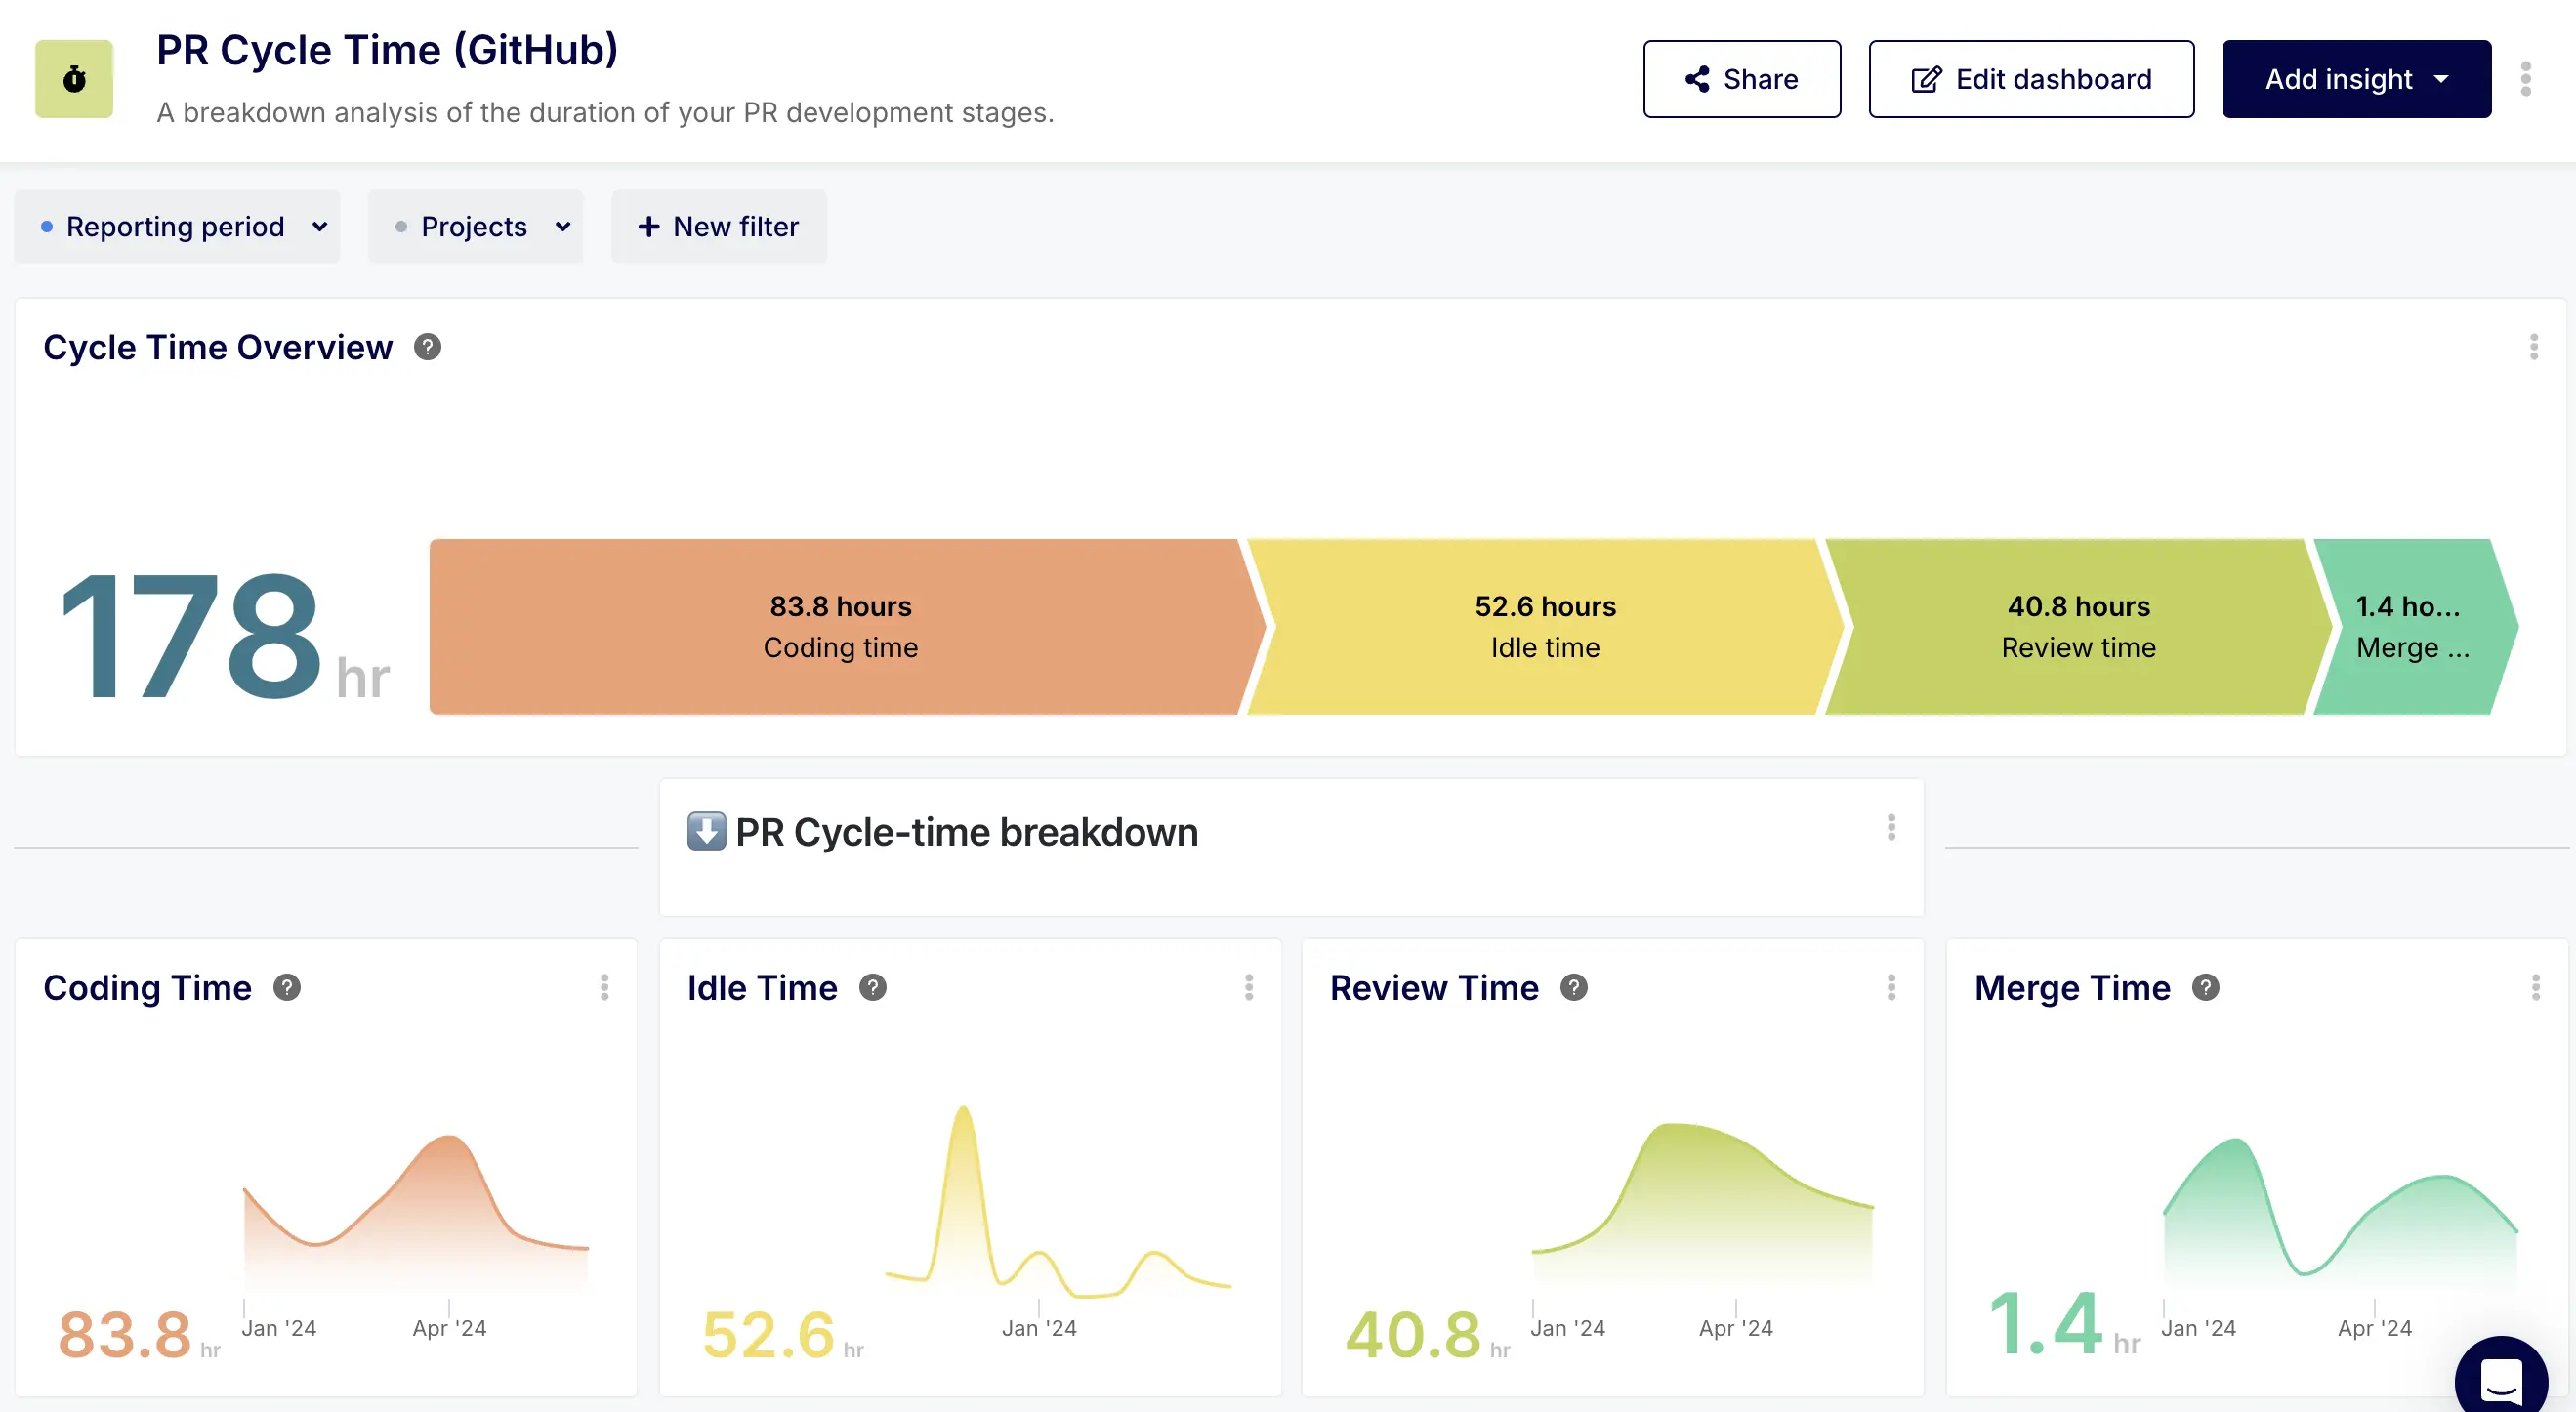
Connecting your Azure DevOps organization—whether on Cloud or Server—to Keypup gives you a complete, real-time picture of your development lifecycle. Move past siloed data and manually-built reports.

hq.keypup.io/azure/overview
Azure DevOps Dashboard
Pipeline Success 99.9% Stability
Lead Time < 4 Hours
▼ 20%
TRUSTED BY ENGINEERING LEADERS AT
DORA Metrics

Measure Delivery with Industry Standards

Track the four key DORA metrics to measure the performance of your software delivery process on Azure DevOps. Identify bottlenecks in your pipelines instantly.

  • Deployment Frequency See how often you release to production.
  • Change Failure Rate Track deployments that cause failure.
  • Time to Restore Monitor recovery speeds from failures.
Azure DORA Metrics Dashboard
Team Collaboration

Foster a Healthier Engineering Culture

Understand how your team works together. Analyze review distributions and workload balance to prevent burnout and ensure knowledge sharing across your Azure projects.

  • Review Distribution See who is reviewing code and where bottlenecks lie.
  • Workload Balance Ensure tasks are distributed fairly.
  • PR Cycle Time Reduce the time from open to merge.
Team Workload Analytics

Why did the payment-gateway pipeline fail this morning?

Keypup AI

The build failed due to a timeout in the integration-tests step. This pipeline has seen a 15% increase in failure rate over the last 7 days.

Ask about your pipelines...
AI Assistant

Query Your Pipelines in Natural Language

Don't waste time digging through Azure DevOps logs. Simply ask Keypup AI to identify failed builds, long-running PRs, or sudden drops in deployment frequency.

Explore AI Features

Built for the Enterprise Stack

Enterprise-grade connectivity for complex Azure DevOps environments.

Cloud & Server

Whether you use Azure DevOps Services (Cloud) or Azure DevOps Server (On-Prem), Keypup connects securely.

Unified View

Mix and match. View Azure DevOps data alongside Jira, GitHub, or GitLab in a single dashboard.

Code Hygiene

Track refactoring ratios and code quality metrics to keep technical debt under control.

Intelligent Drill-Down

Click any metric—like "Change Failure Rate"—to reveal the specific Commits or Pipelines causing the trend.

Filtering UI

Trusted by Engineering Leaders

See why modern development teams rely on Keypup to ship faster.

“Keypup allowed us to extract a lot of information from Github that would not be easily accessible otherwise. The support has been great, and the ability to get on a call and go through dashboards I've built has been very helpful in unlocking new possibilities to use the product. We now see what our engagement looks like between members and non-members, allowing us to better understand and interact with our community.”

Read their story

“We increased our YoY productivity by 45% and Keypup helped us identify our pain points and change the game faster. Their support is the best – they helped us understand which metrics would suit our needs, built dashboards for us, and explained them in detail to us. With Keypup I can now say that we really manage our Engineering teams.”

Read their story

“I was genuinely impressed with Keypup, not only because of the ease and speed of integration with our tools but also because it provided immediate access to DORA and other key customizable metrics. The standout was the customer support — they swiftly provided a personalized dashboard that enabled me to comprehend and compute real-time metrics with remarkable ease.”

Read their story

“Keypup is a highly useful and practical platform, boasting user-friendly features and lightning-fast report generation.

The service provided by customer support was excellent, showcasing their dedication to customer satisfaction. We are delighted to be part of the Keypup community.”

Ready to optimize your Azure Pipelines?

Join engineering leaders using Keypup to improve delivery speed and quality.